
Deploying an application
An application is a Compose file plus the things ProxDock adds around it: a ZFS dataset of its own, an address on a network zone, and a place in the backup schedule. This page walks a real deploy of a bundled template on a single-node cluster.
Every screenshot is a capture of the real thing. Addresses and MAC addresses in them are fictional; nothing else has been touched.
1. Pick a template, or bring your own
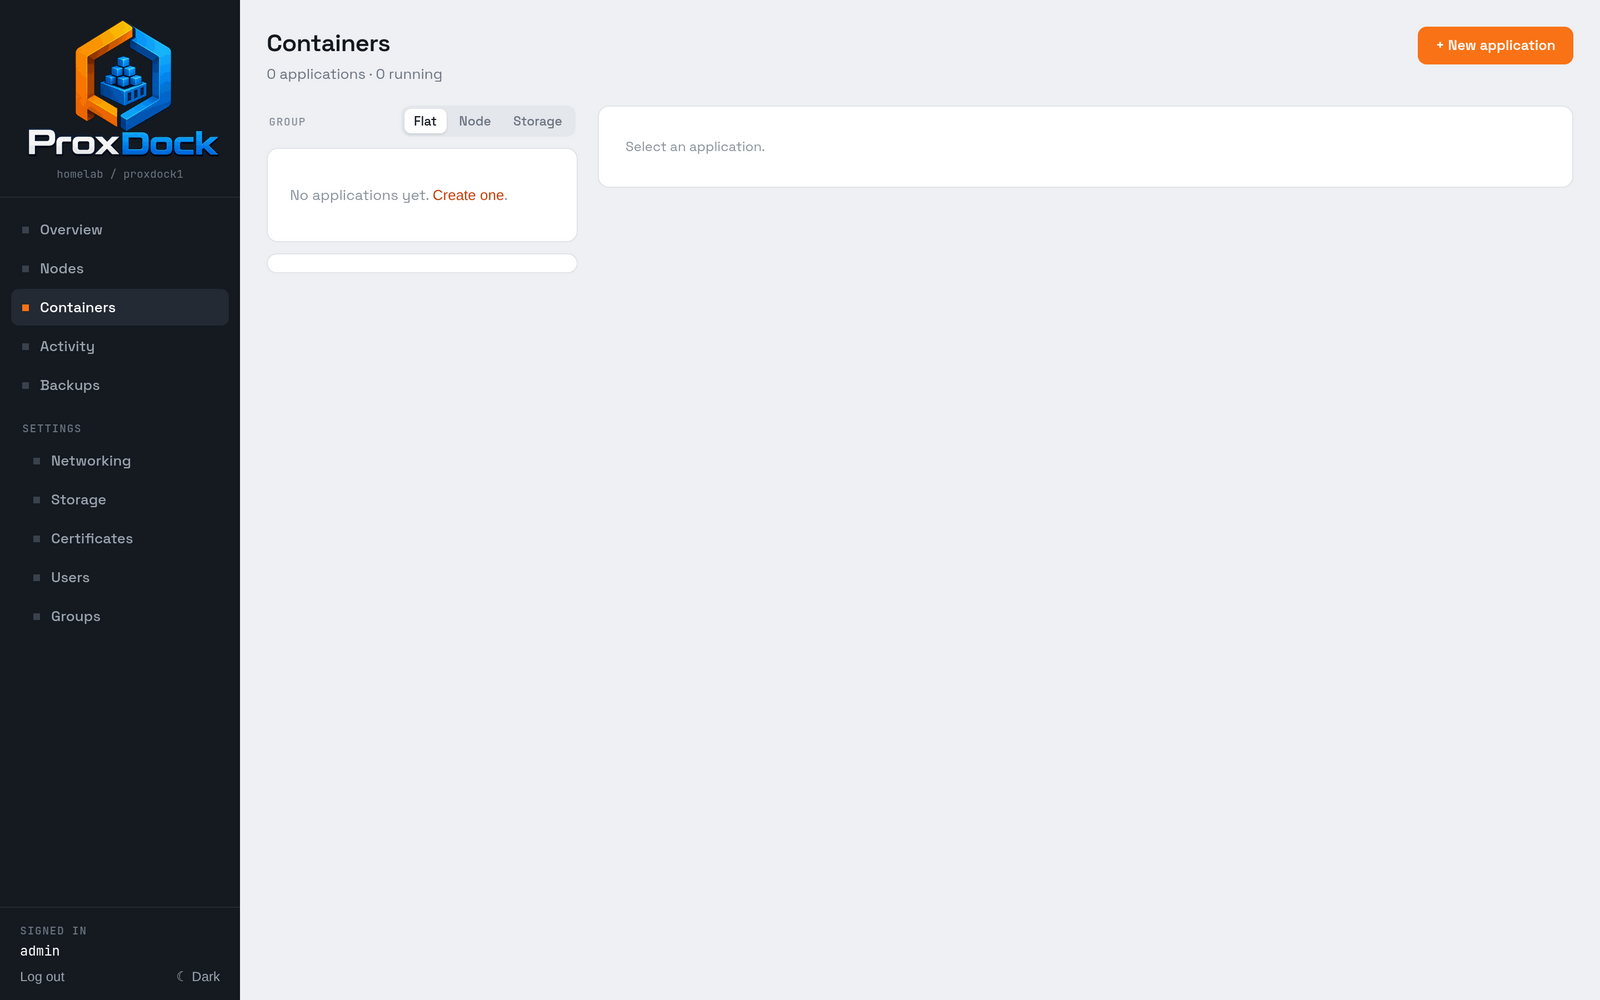
Containers is where applications live. On a fresh cluster it is empty.
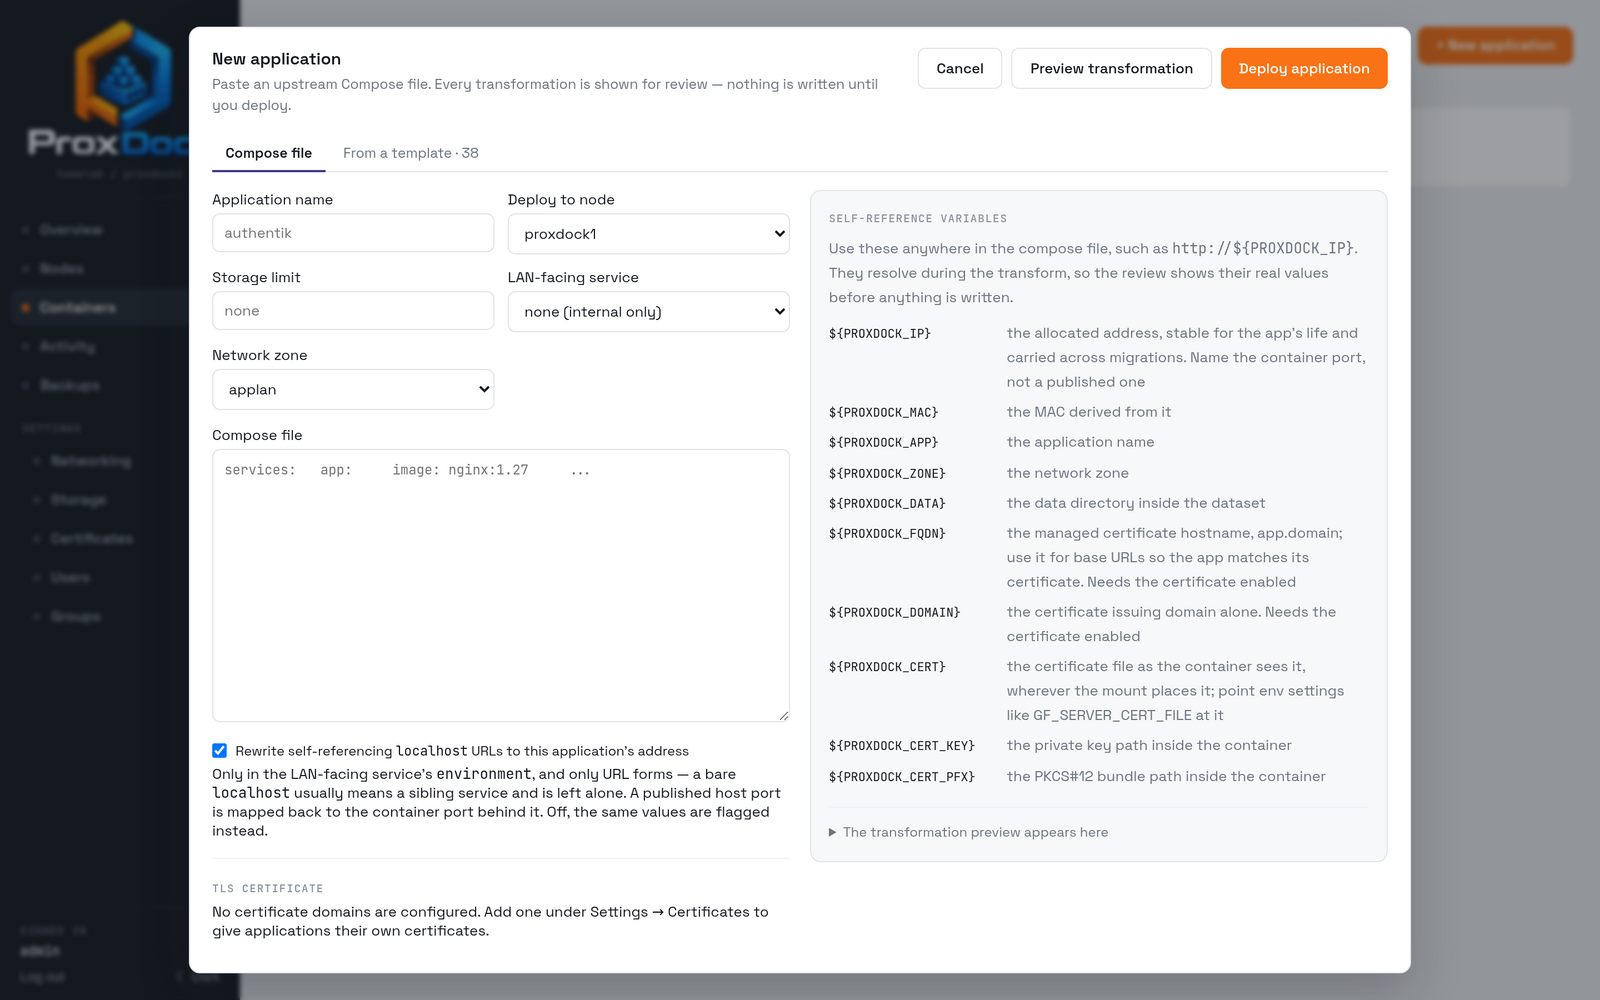
New application opens on the Compose tab, where you paste a file of your own. The other tab is the bundled library.
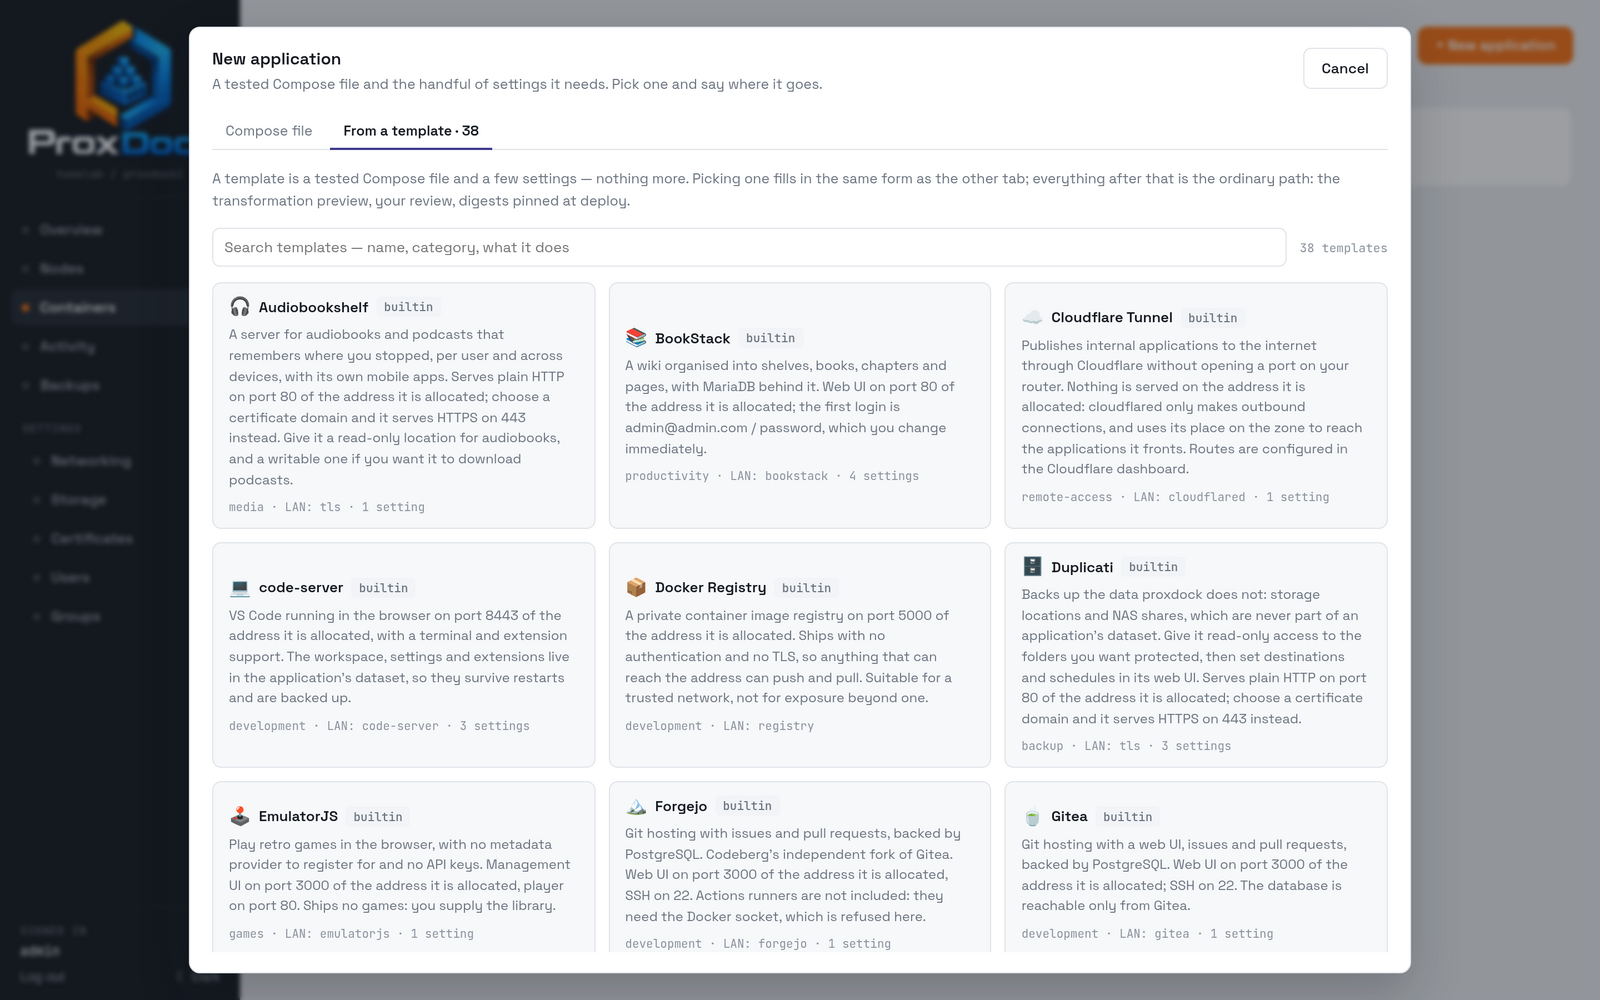
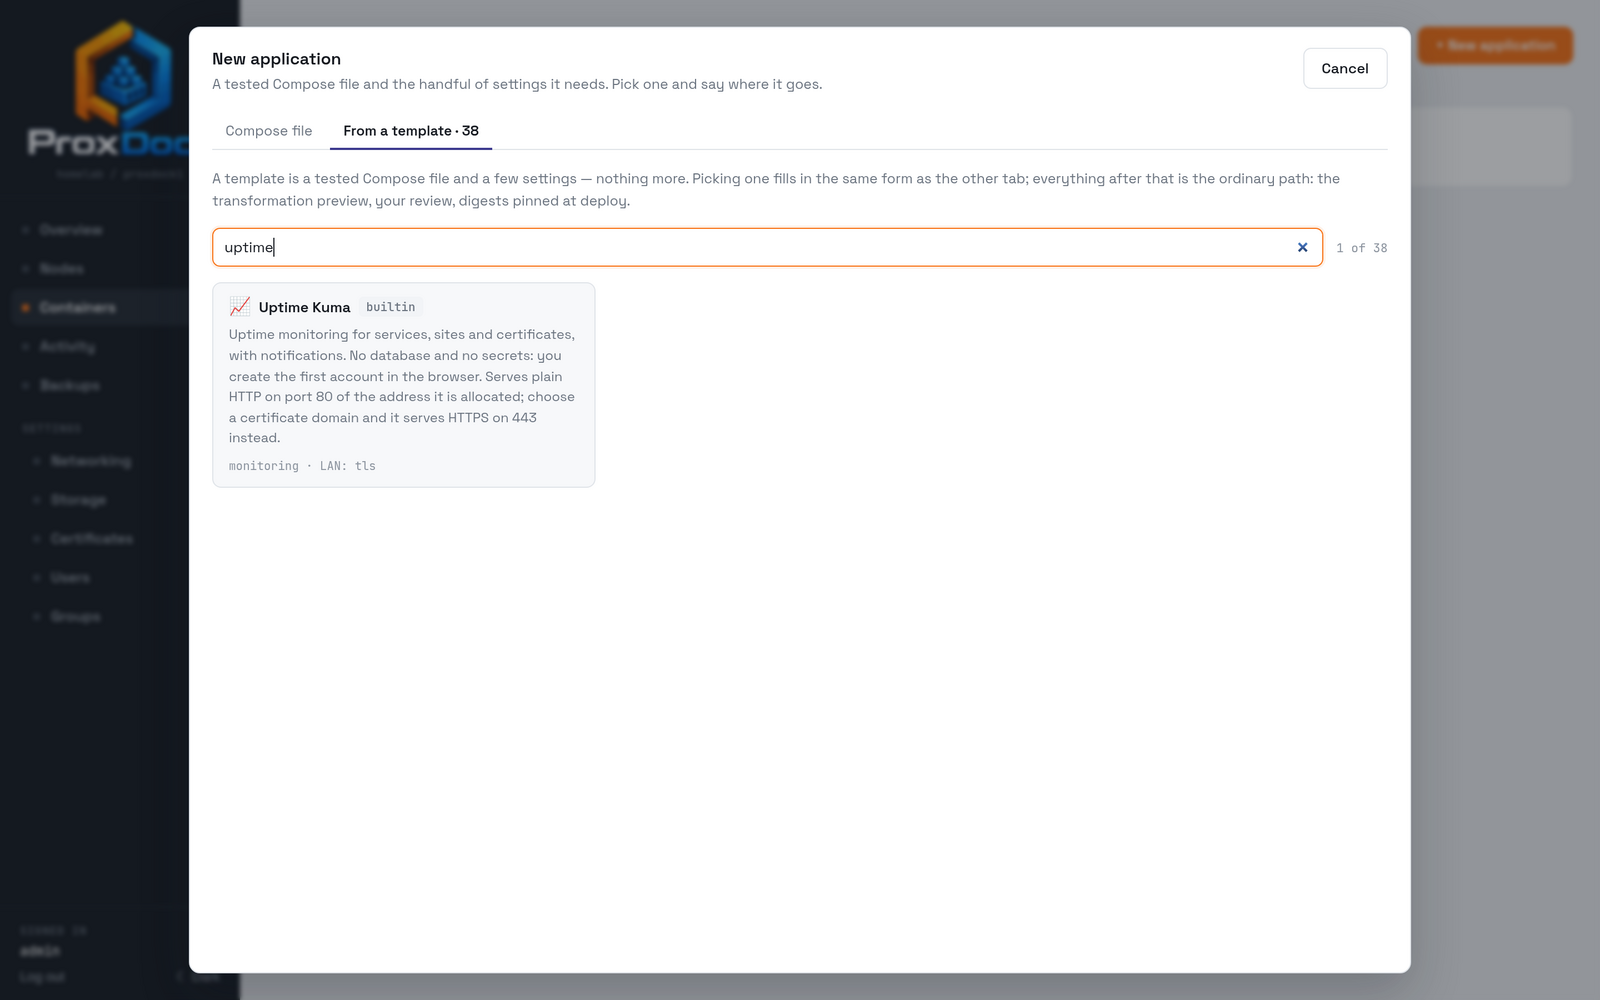
The search covers the name, the category and the description, so "uptime" and "monitoring" both find the same thing.
2. Fill in what it needs
Picking a template fills in the ordinary create form. Most templates need very little: a name, a node, and a zone.
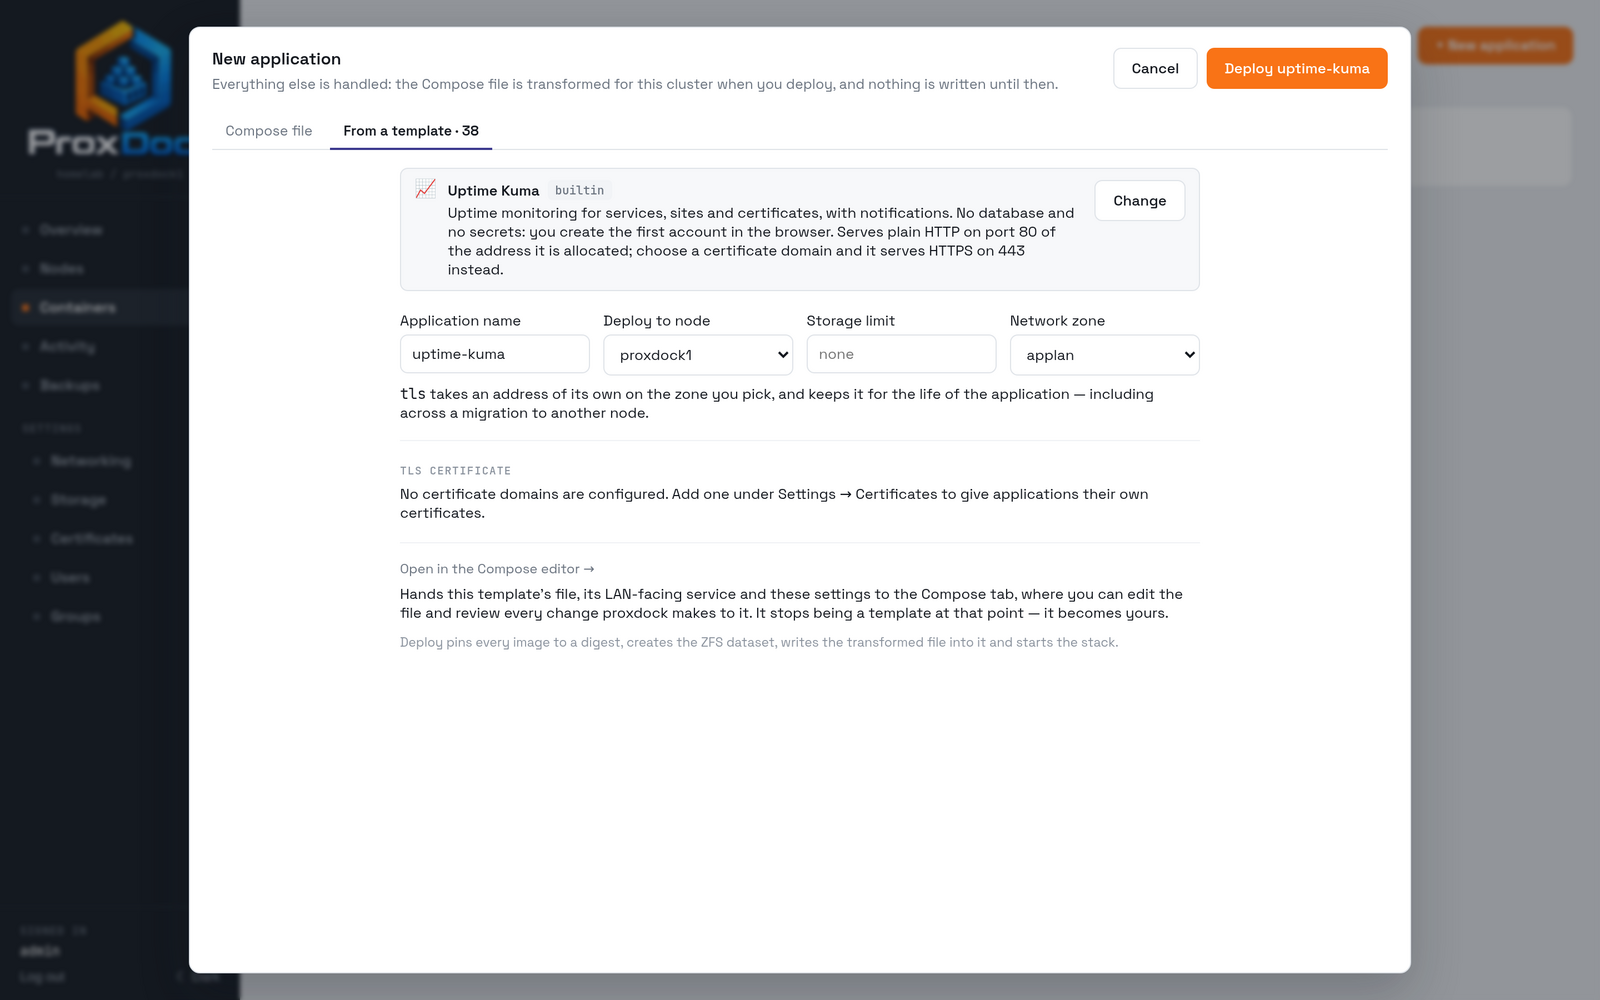
Uptime Kuma is a good example of why that field exists. The template deploys two services: Uptime Kuma itself, and a small Caddy front end that terminates TLS. Caddy is the one that faces the LAN, so it takes the address; Uptime Kuma is reachable only from inside the stack.
3. Read what it will do
The curated form deploys straight away. Open in the Compose editor takes the same template to the Compose tab with its file loaded, which is where the transformation preview lives.
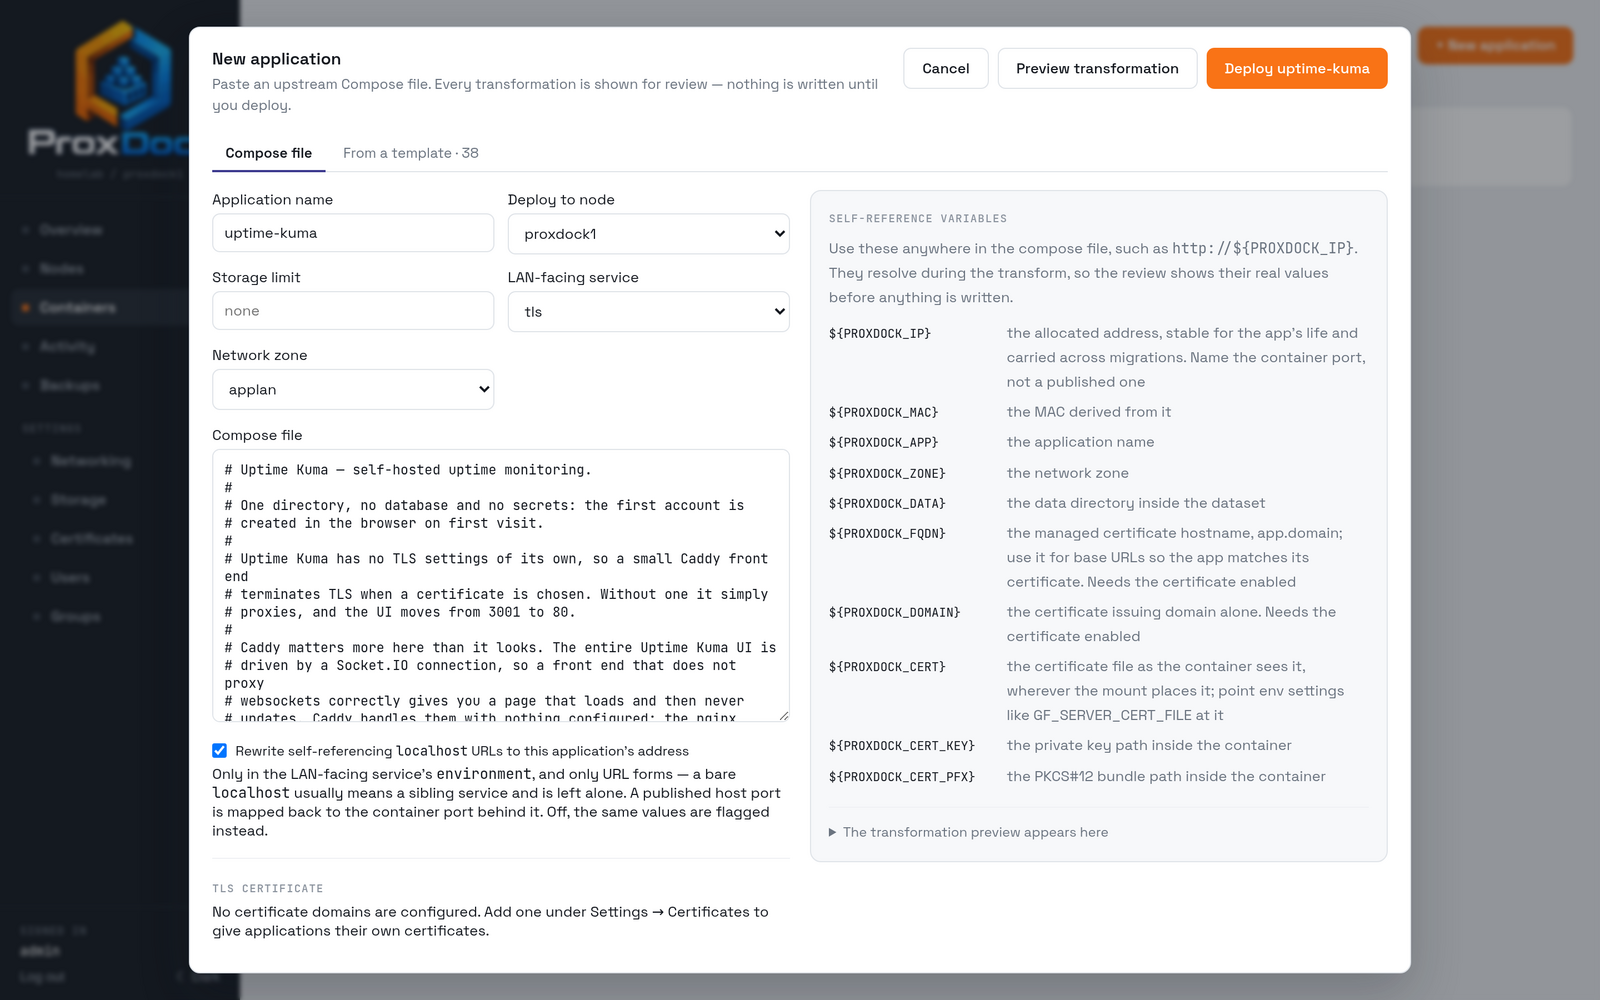
Preview transformation shows every change before anything is written.
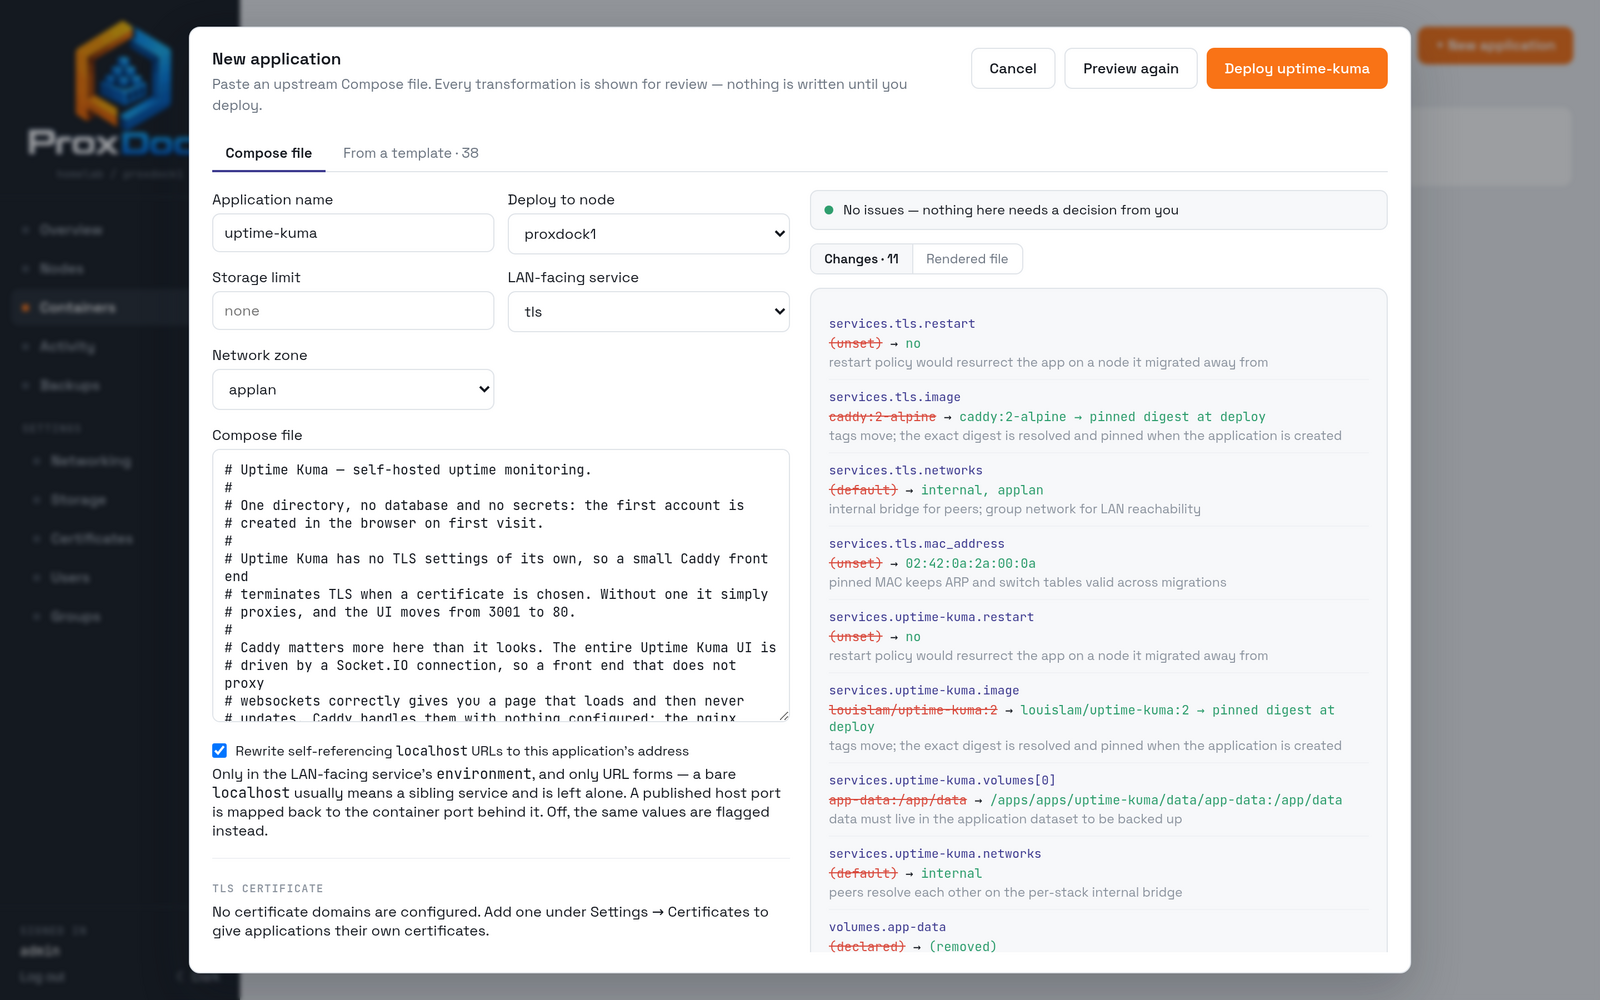
Some of what it did here:
| Change | Why |
|---|---|
restart set to no |
A restart policy would resurrect the app on a node it migrated away from |
image pinned to a digest |
Tags move; the exact digest is resolved and pinned at deploy |
networks split |
An internal bridge for peers, plus the zone for LAN reachability |
mac_address set |
A pinned MAC keeps ARP and switch tables valid across migrations |
volumes rewritten into the dataset |
Data must live in the application dataset to be backed up |
| The named volume declaration removed | It has nowhere left to point |
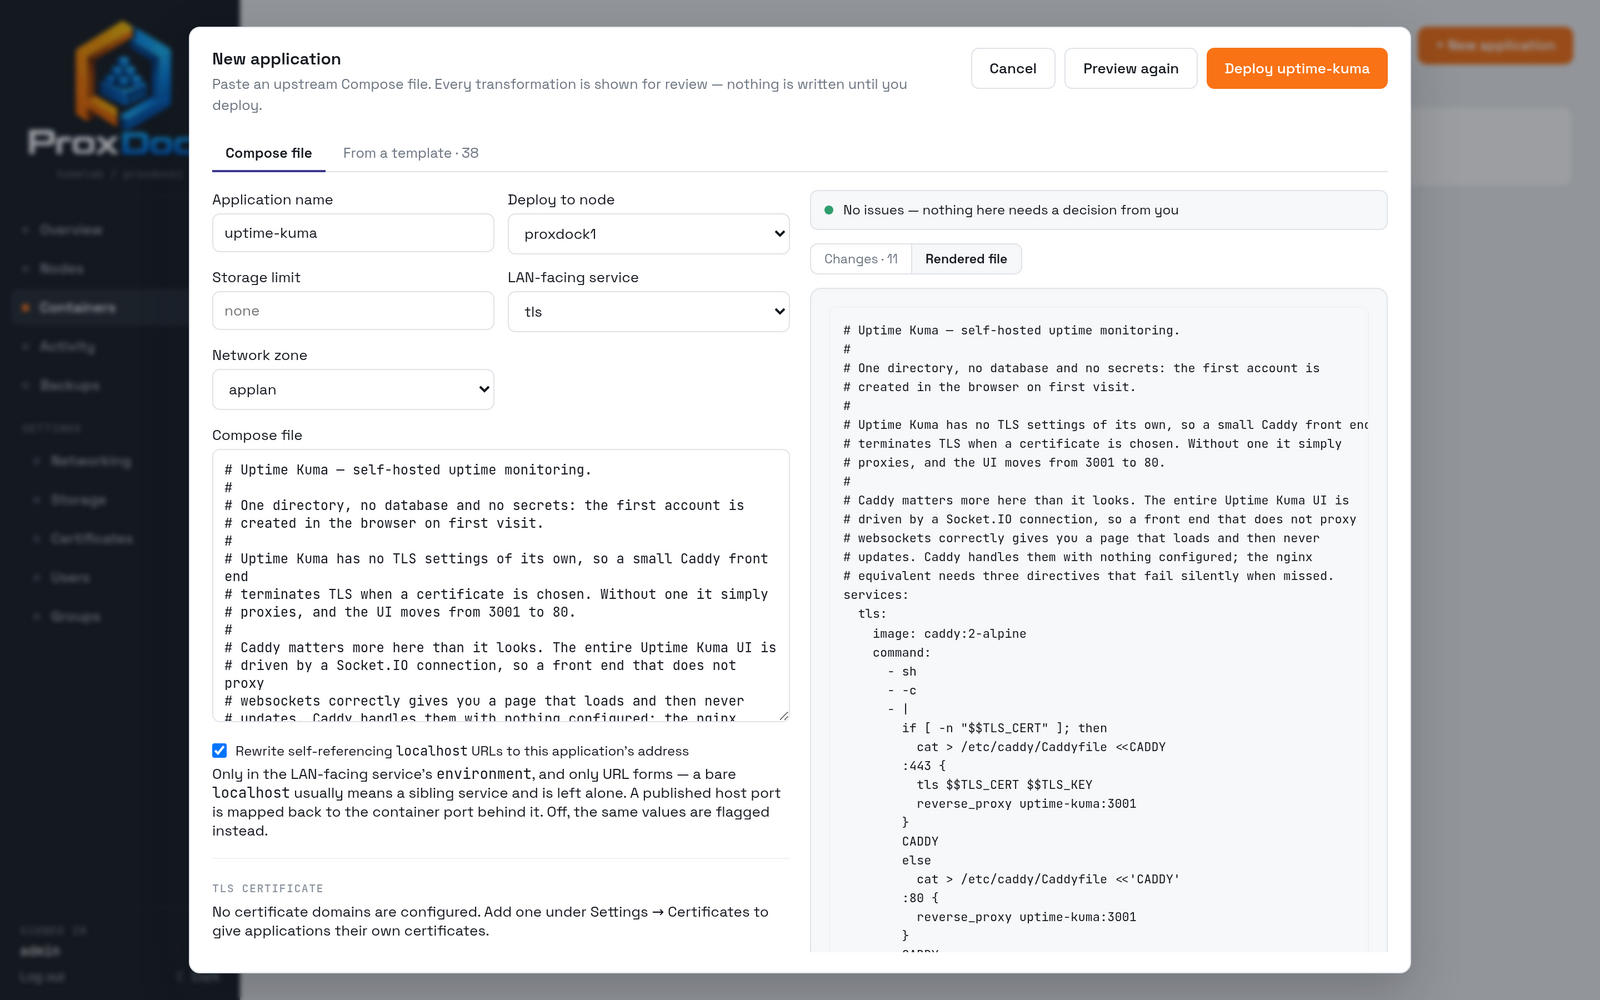
The other half of the preview is the file that comes out.
Compose files covers the rules in full, including what is refused outright.
4. Deploy
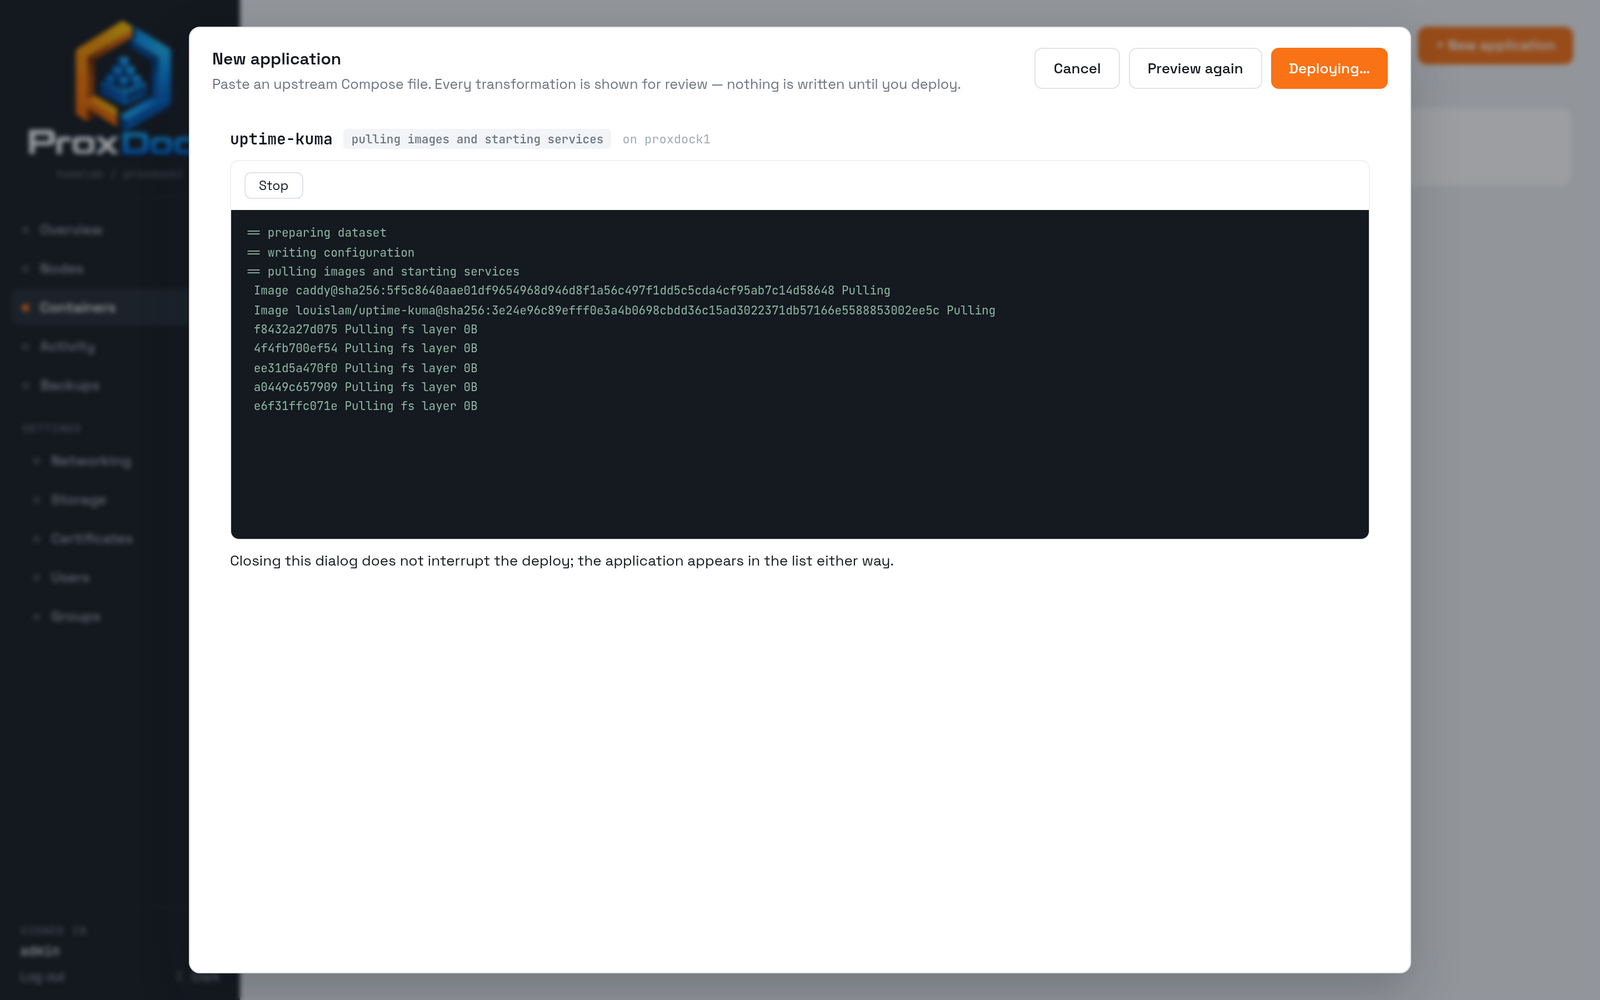
The form is replaced by a pane that streams docker compose's own output, so a
slow image pull looks like a slow image pull rather than a hung dialog.
5. What you get
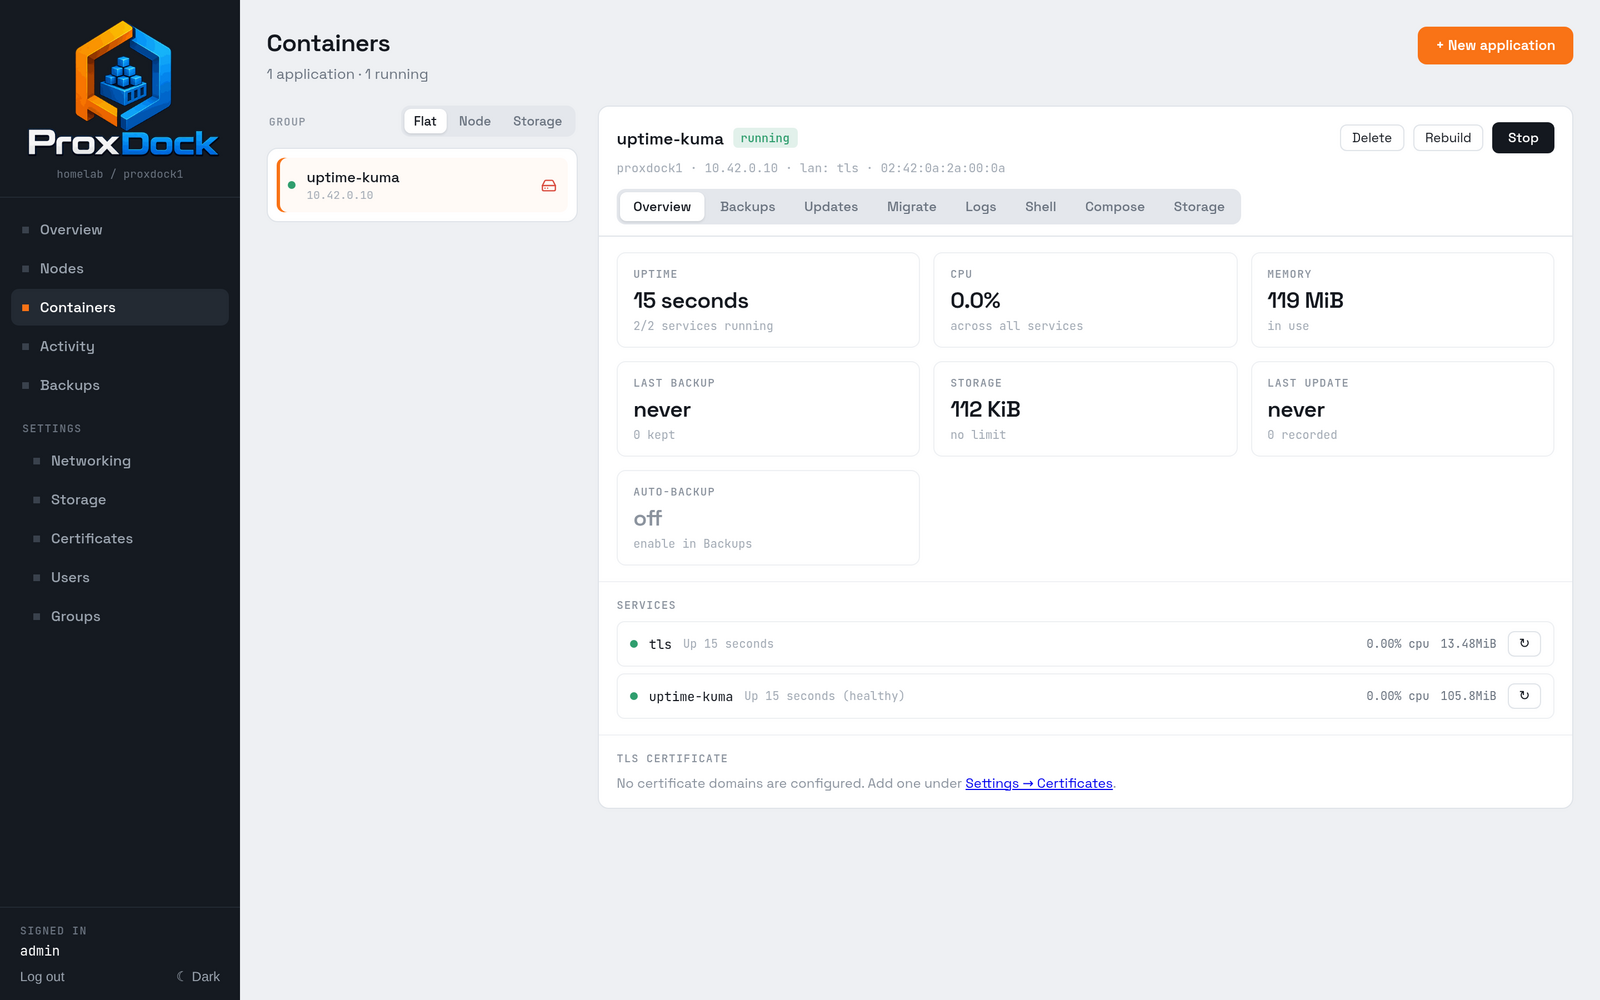
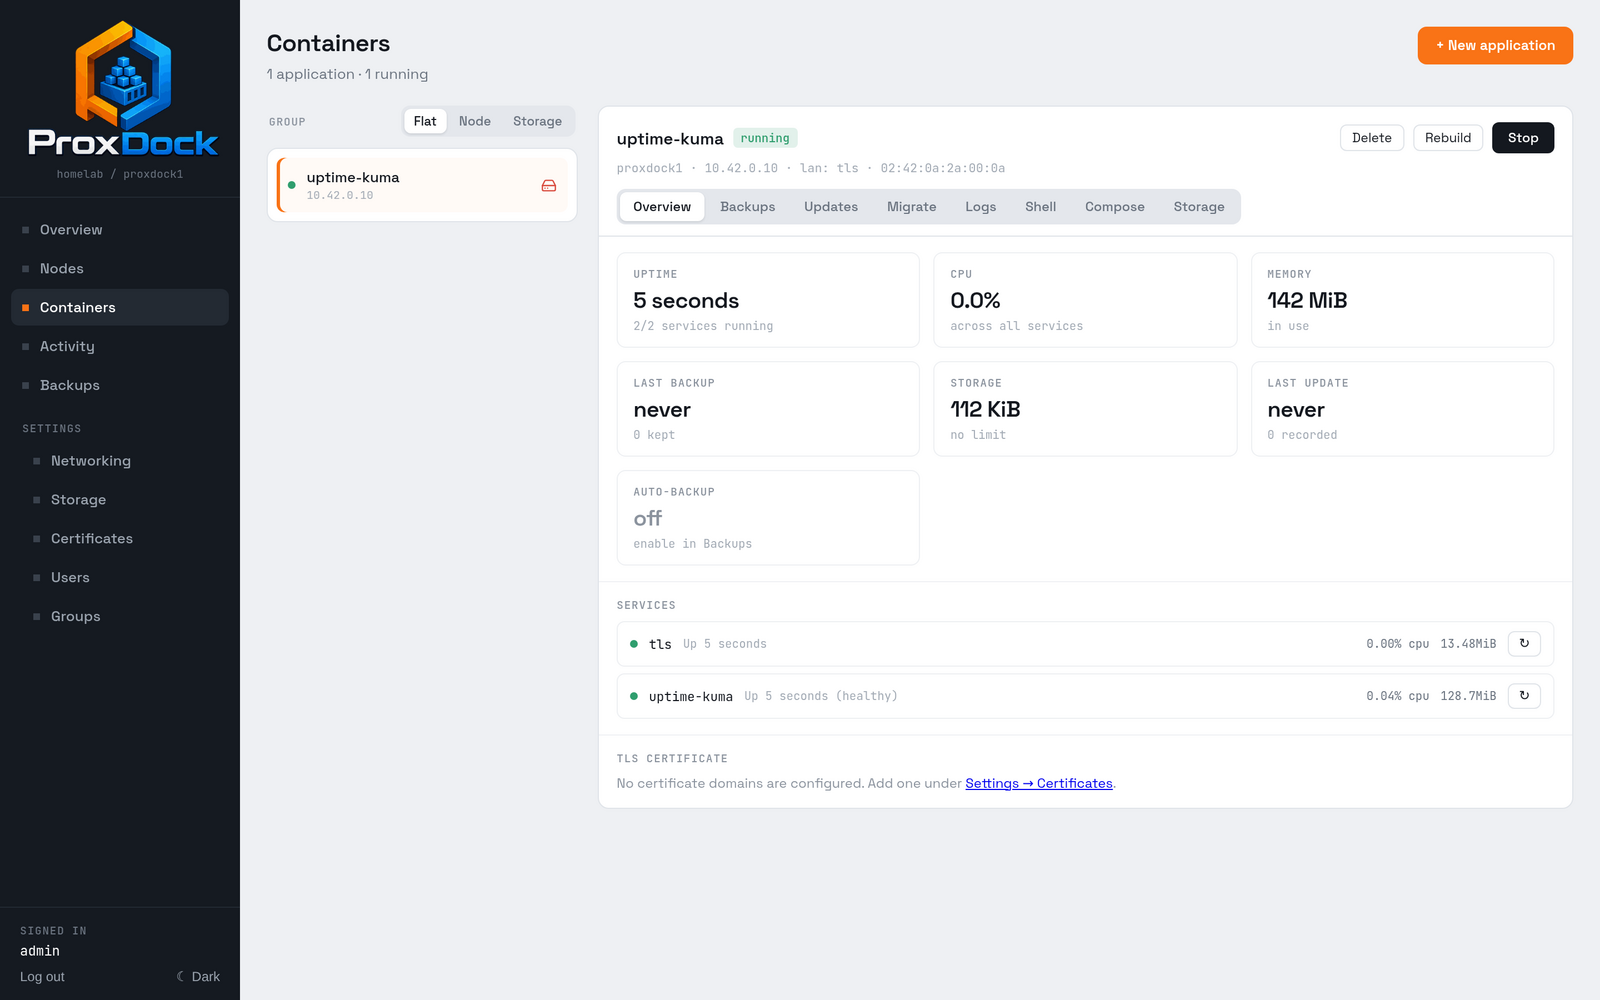
A dataset was created for it, with a baseline snapshot taken once it came up:
apps/apps/uptime-kuma
apps/apps/uptime-kuma@created
That snapshot is what a rollback returns to, and the dataset is what a backup sends.
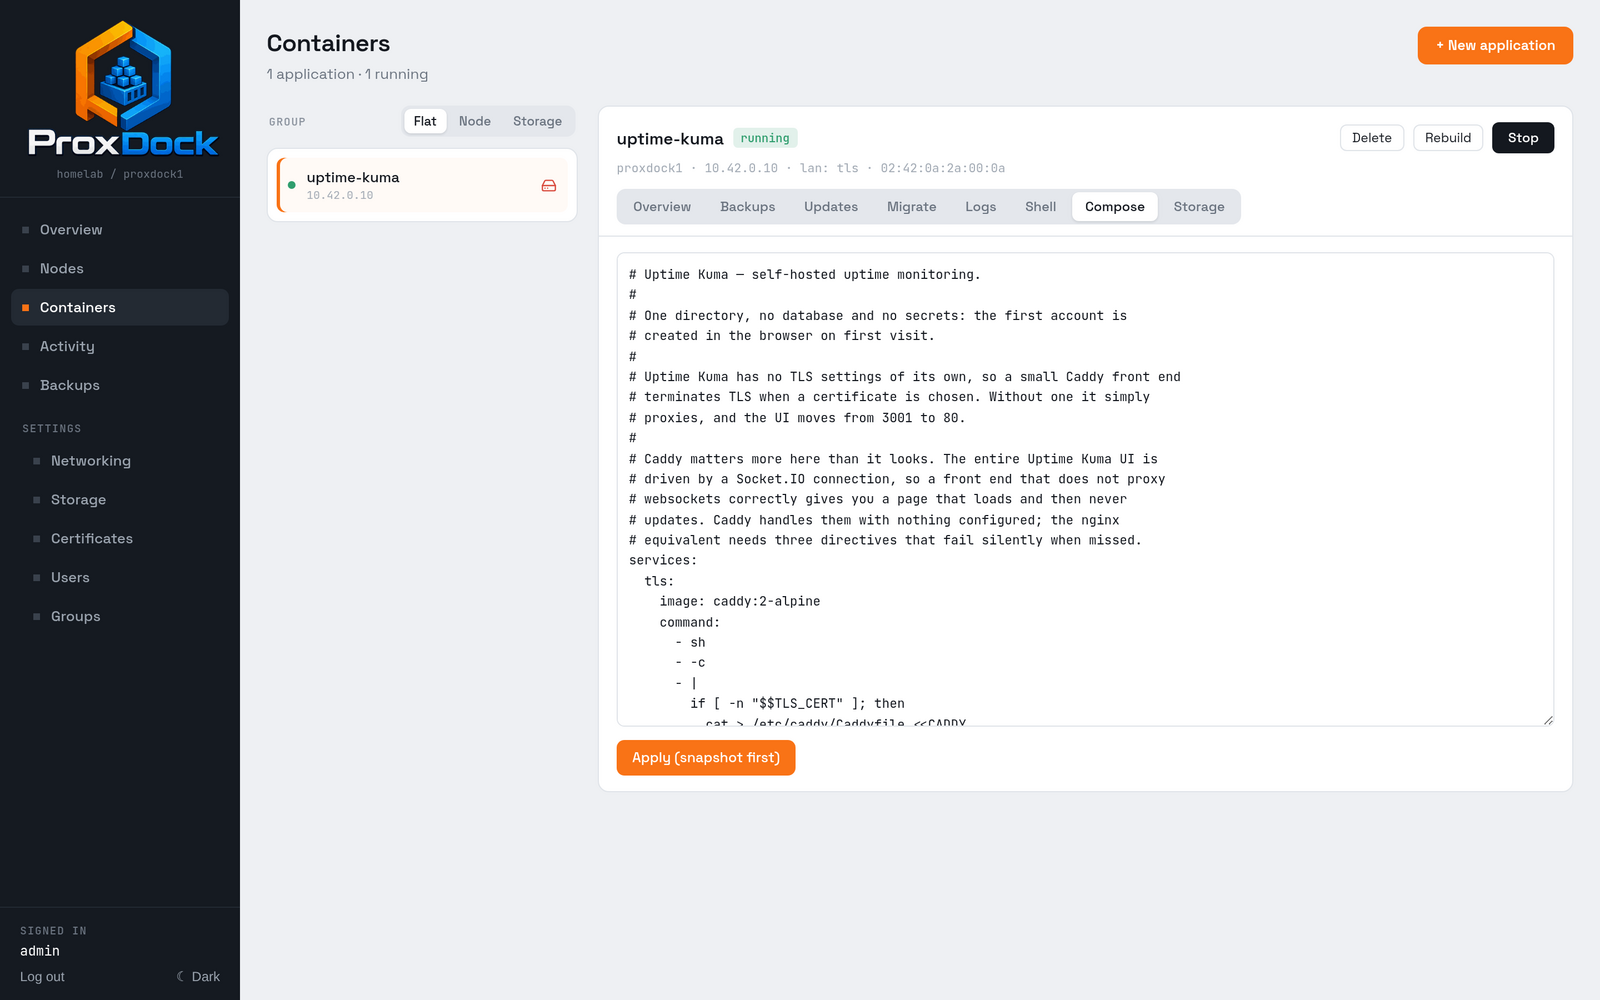
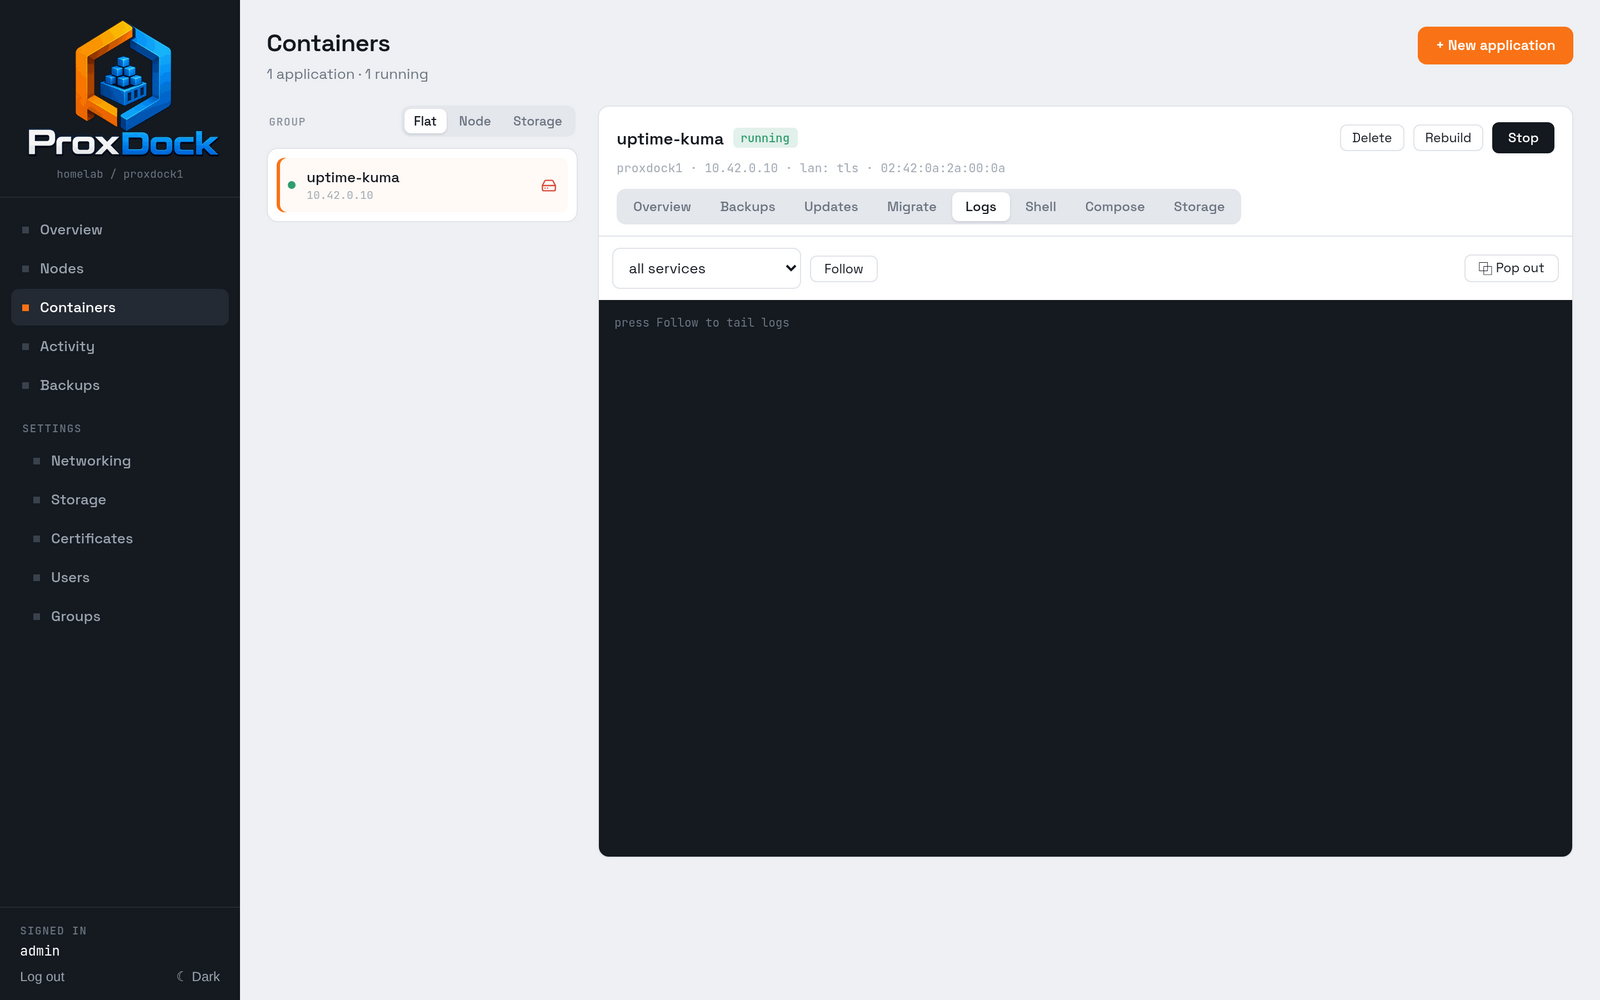
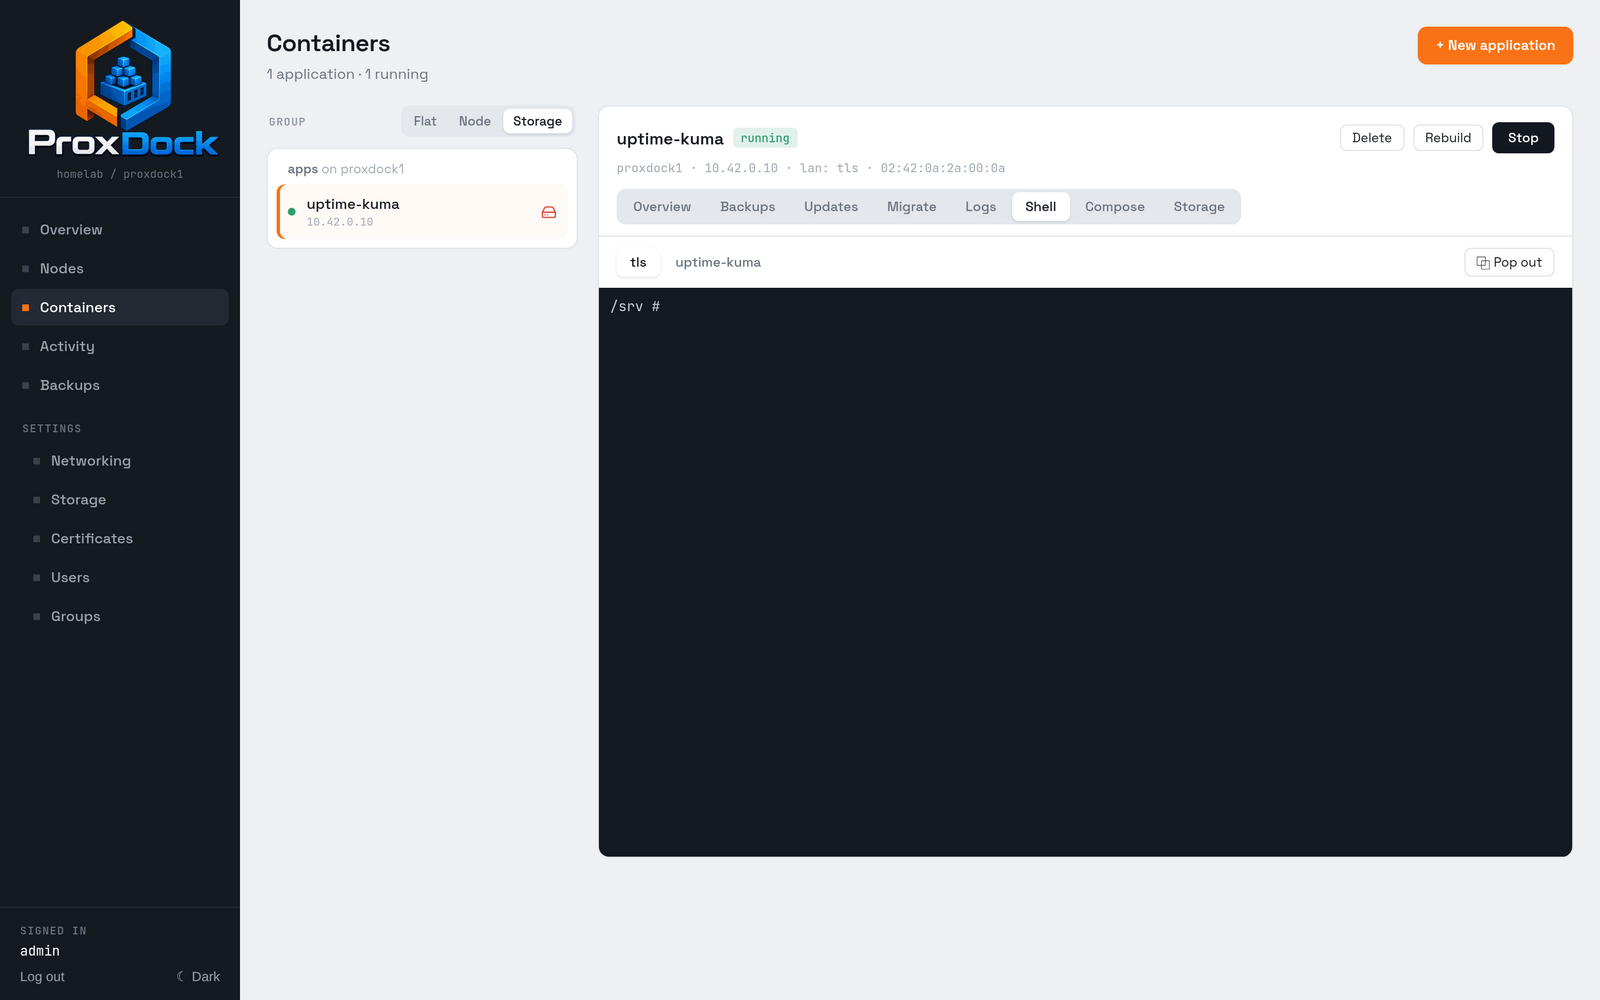
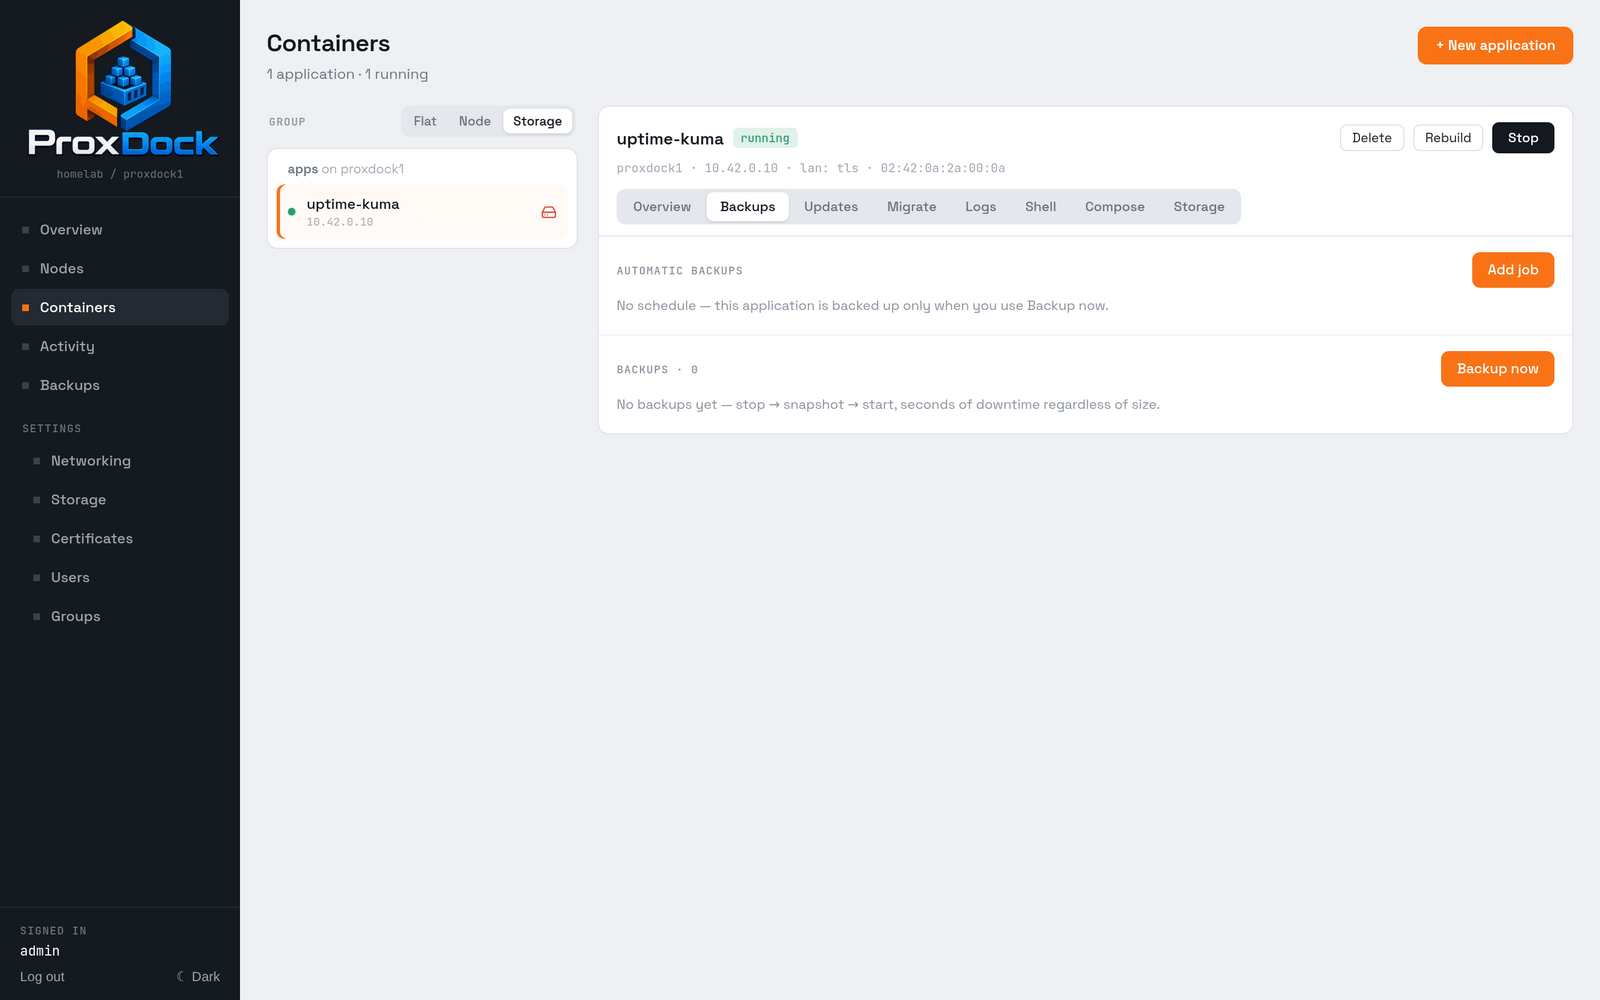
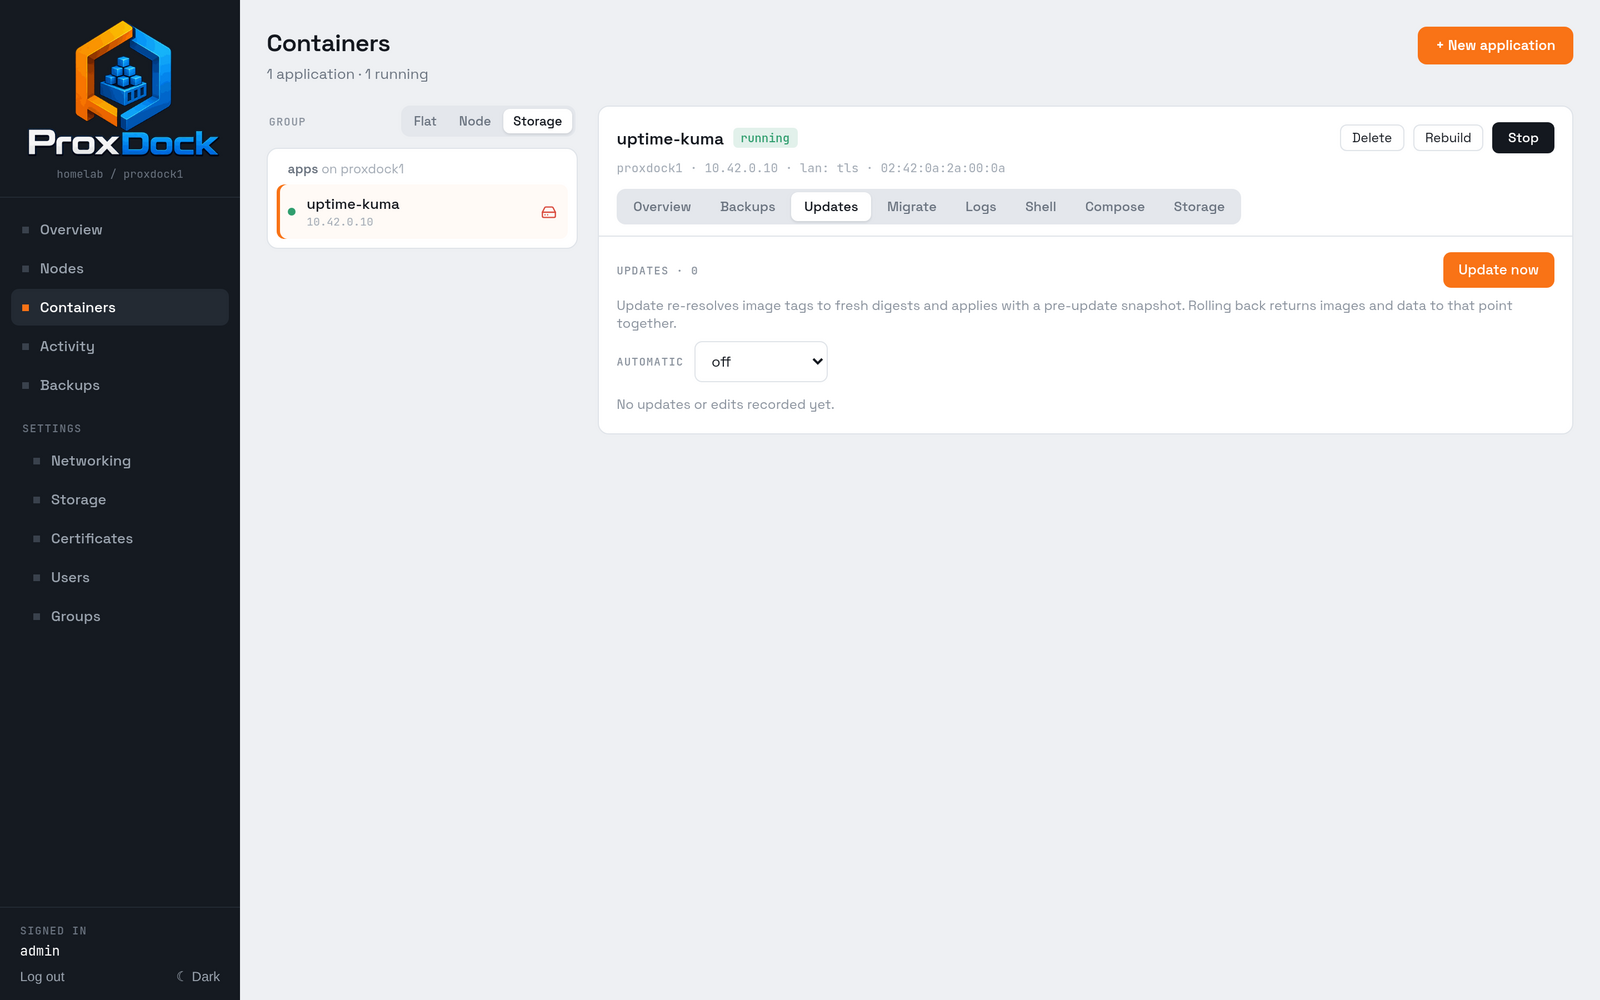
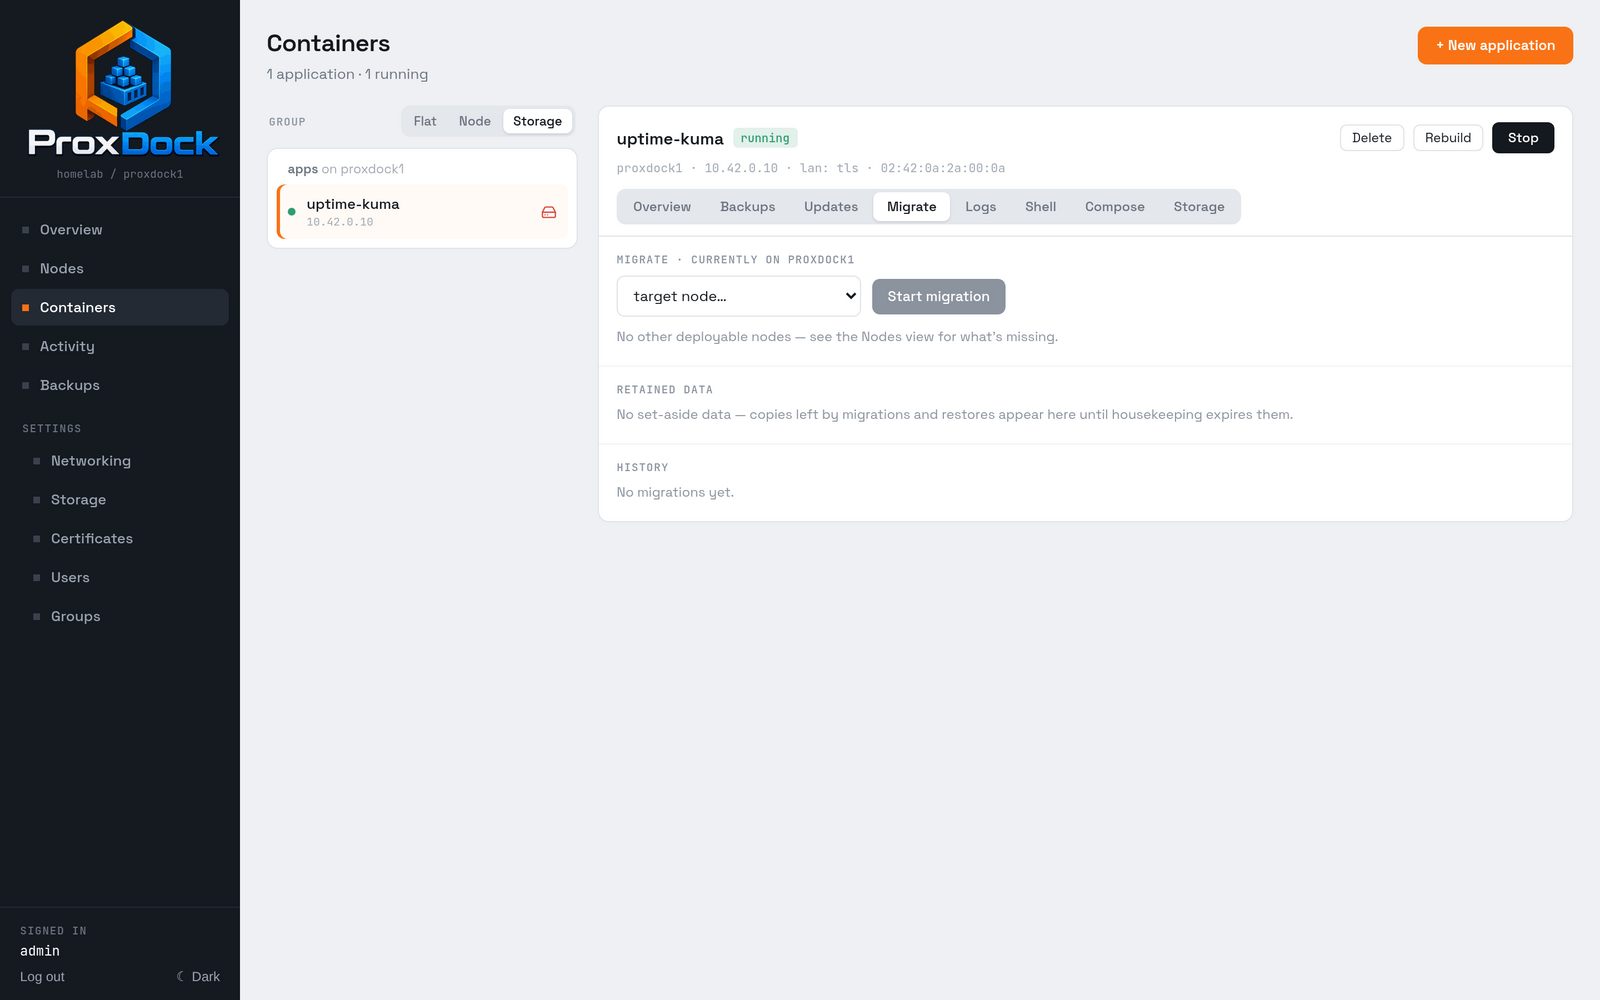
The detail tabs
Each tab owns its concern completely rather than scattering it across pages.
Where to go next
- Compose files: what the transformation changes, and what it refuses
- Backups and restore: scheduling this application's backups
- Running a cluster: adding nodes, and migrating between them